ATAS Indicator: RAIN High-Probability Reaction Levels
✅ Overview
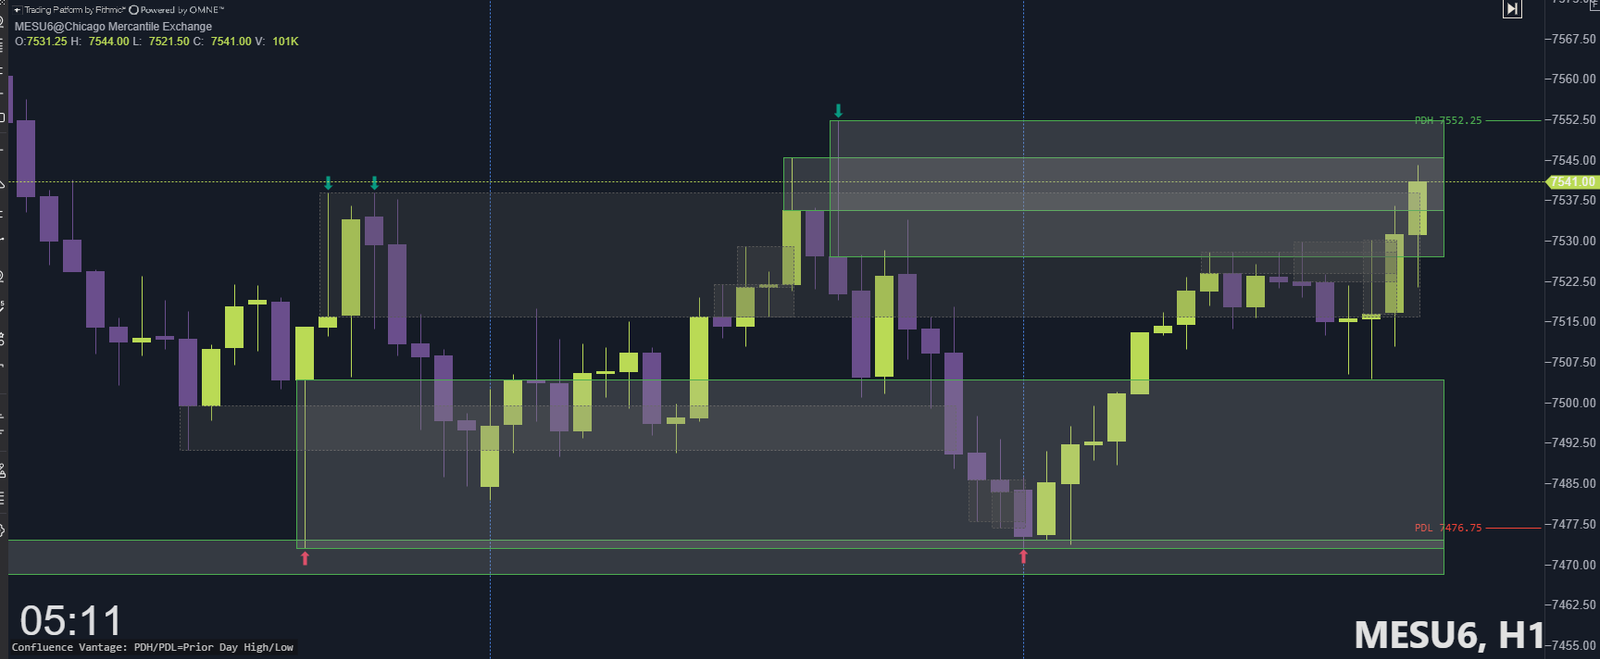
A custom ATAS indicator built around the RAIN methodology that automatically identifies high-probability reaction areas before price gets there.
RAIN High-Probability Reaction Levels helps traders quickly locate where the market is most likely to respond by combining liquidity, higher-timeframe structure, and key daily reference points into one streamlined trading workspace.
Instead of manually drawing levels, RAIN automatically maps the areas where traders already look for opportunity:
Liquidity sweeps
Higher-timeframe moving averages
Prior session extremes
Structural reaction points
This is not a signal generator.
No arrows. No automated entries. No black-box predictions.
The goal is simple:
Know where the market is making decisions before you execute.
Tested on:
Futures — ES (1-hour timeframe)
Compatible with:
Any market supported by ATAS
🧰 What's Included
✔ 1. RAIN High-Probability Reaction Levels Indicator File
Compiled ATAS custom indicator ready for installation.
Includes:
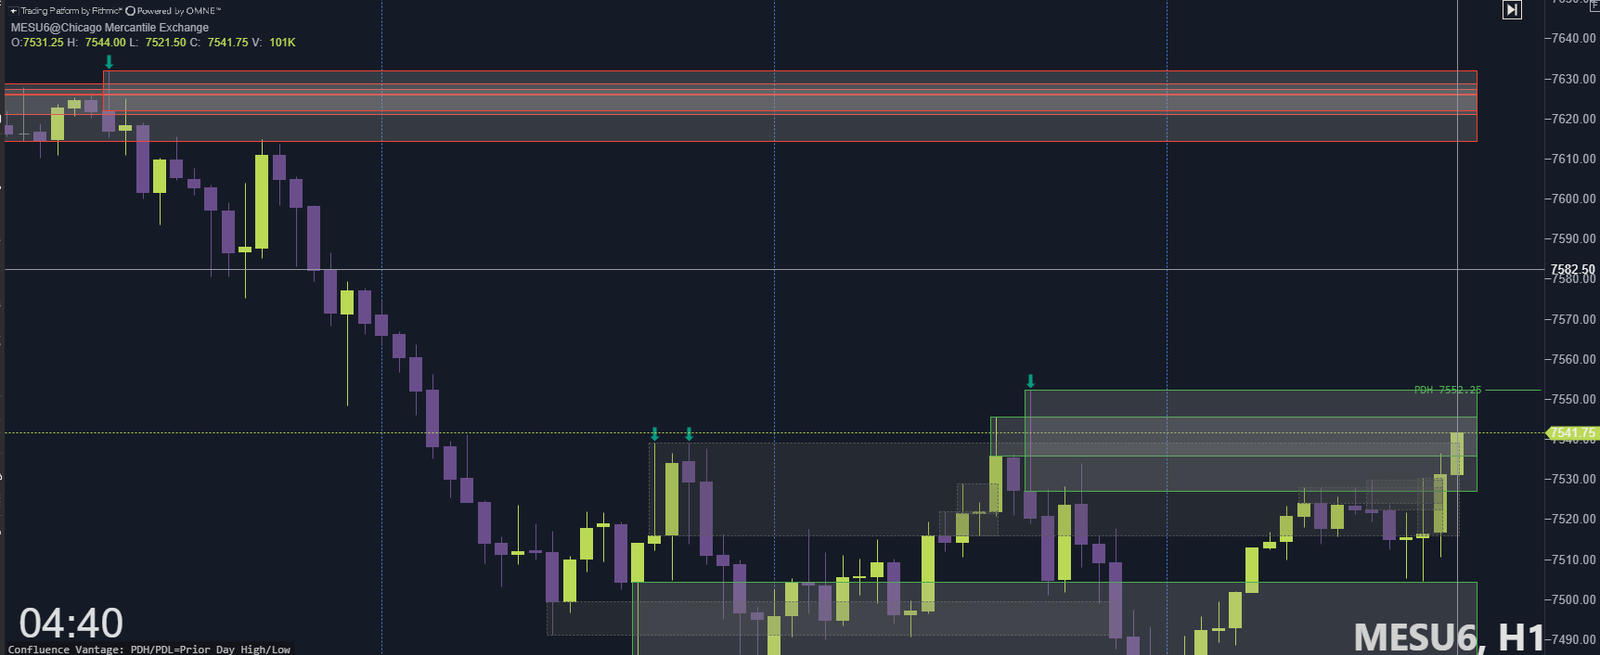
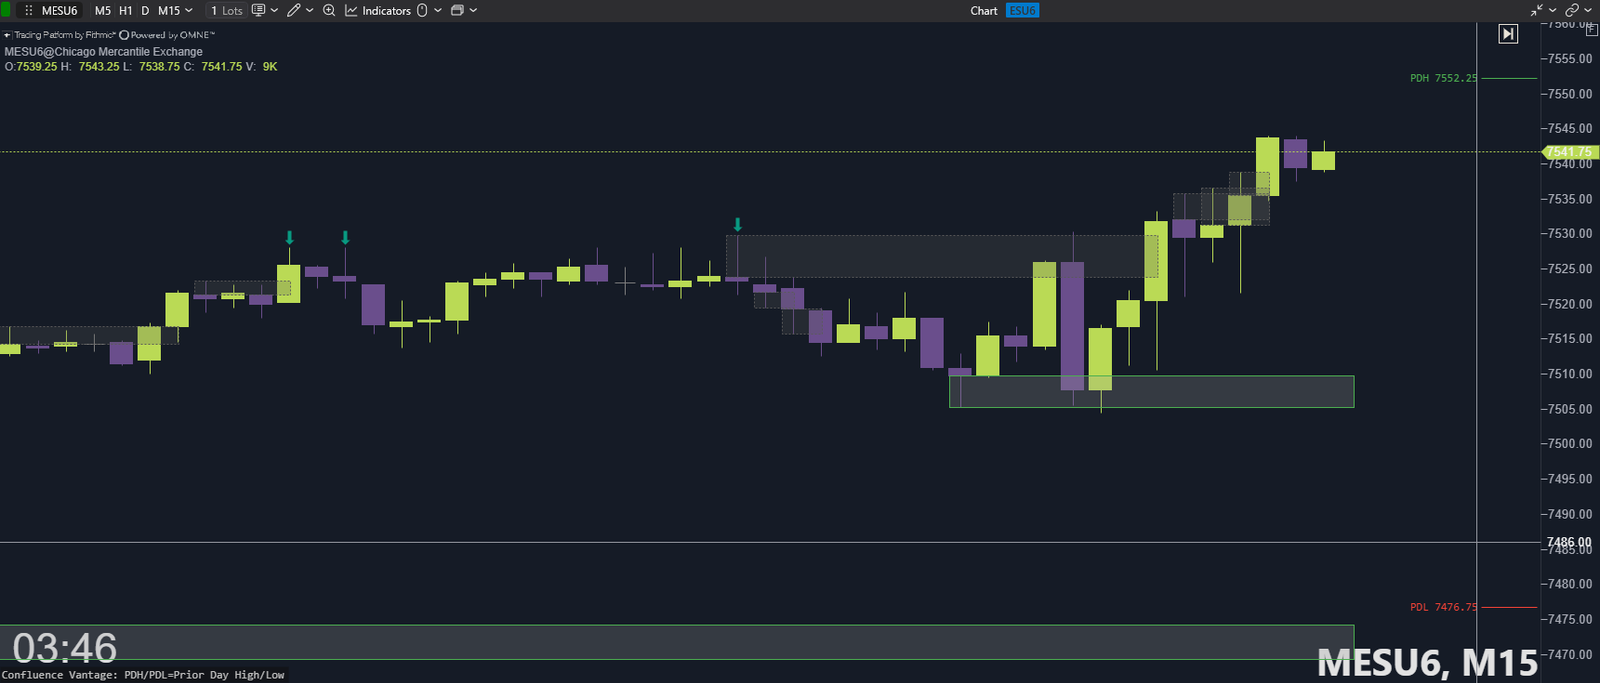
🔹 Liquidity Reaction Zones
Automatically detects stop-run areas where price:
Sweeps a recent high or low
Takes liquidity above/below structure
Rejects back into the previous range
The indicator automatically marks these areas as potential reaction zones.
🔹 Daily SMA Reaction Levels
Higher-timeframe moving averages plotted directly onto your intraday chart:
20 SMA
50 SMA
100 SMA
200 SMA
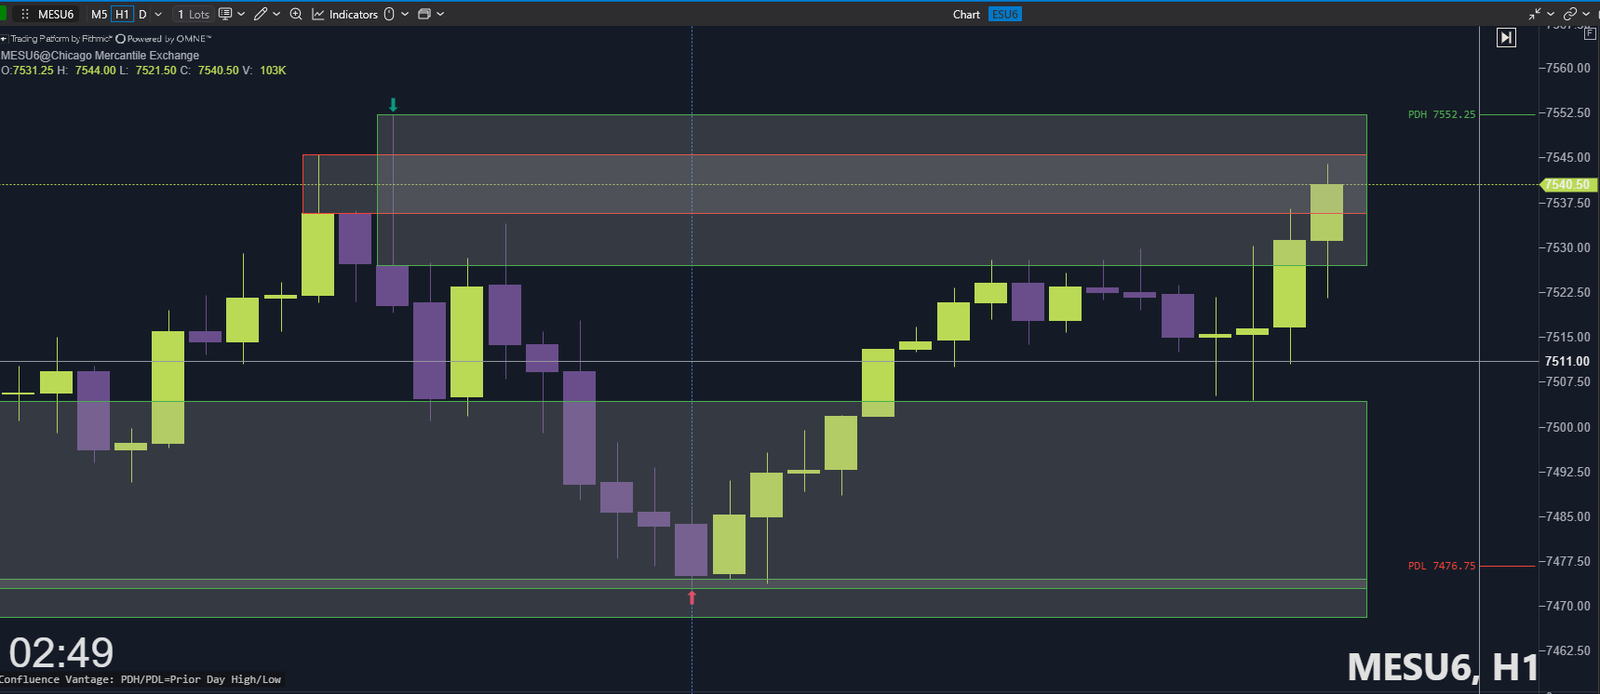
🔹 Previous Day High / Low
Automatically plots:
PDH
PDL
With clean labels and exact pricing.
🌧️ RAIN Reaction Level Breakdown
🔴 Liquidity Reaction Zones
Markets often move through obvious highs and lows to trigger stops before reversing or continuing.
RAIN identifies these liquidity events by detecting when:
Price breaks a recent swing point
The breakout fails
Price closes back inside structure
The indicator then automatically marks the reaction area.
Red Zone
Swept High Liquidity
Potential supply reaction area.
Watch for:
Failed breakouts
Rejection
Short opportunities while the zone remains valid
Green Zone
Swept Low Liquidity
Potential demand reaction area.
Watch for:
Failed breakdowns
Reversals
Long opportunities while the zone remains valid
Zone Status
Solid Zone
→ Reaction level remains intact.
Dashed/Grey Zone
→ Price has accepted through the level.
The original reaction thesis is invalidated. Watch for continuation or break-and-retest behavior.
📈 Daily SMA Reaction Levels
The Daily SMA Suite brings higher-timeframe context directly onto your intraday chart.
Included:
20 SMA
50 SMA
100 SMA
200 SMA
Built from completed daily closes.
Use these levels for:
Trend alignment
Dynamic support/resistance
Higher-timeframe reaction areas
⚠️ The 100 and 200 SMA require sufficient historical data loaded on your chart before appearing.
📍 Previous Day High / Low
One of the most important intraday reference points.
Automatically plots:
Previous Day High
Previous Day Low
Used for:
Breakout locations
Failed breakout setups
Liquidity targets
Reversal areas
🧩 Why Reaction Levels Matter
The strongest market decisions rarely happen at a single level.
They happen when multiple forms of structure align.
Example:
A liquidity sweep into Previous Day High, while interacting with the 50 SMA, creates a much stronger decision point than any one level alone.
RAIN High-Probability Reaction Levels helps you see those areas instantly.
The indicator does not tell you what to trade.
It tells you where the market deserves your attention.
🔥 Where the Indicator Shines
Before executing RAIN Break & Retest setups
At major support and resistance zones
During failed breakouts and liquidity sweeps
When multiple higher-timeframe levels align
When waiting for confirmation instead of chasing price
📦 Additional Info
One-time purchase
Immediate download
Works on all ATAS accounts
Compiled indicator file
All components can be enabled/disabled
Lifetime use
How to Install the Indicator in ATAS
Open ATAS and go to your chart.
Open the Indicators Panel.
In the bottom-left corner, click “Add Custom Indicator.”
Select the RAIN High-Probability Reaction Levels indicator file you downloaded.
Once added, the indicator will appear in your custom indicators list.
Add it to your chart and adjust the settings to your preference.
That’s it — no manual file installation required.